PProf is a great tool to profile and analyze golang programs. Go-ethereum has built in support to start a PProf server and to get both CPU and memory profiles. These profiles are very useful in order to see hot spots that should be optimized. PProf allows us to see where cpu time is spent and where memory is allocated and retained which allows to spot memory leaks quite easily.
Profile
Profiling geth is very easy. You need to start geth with the console subcommand or connect to an existing geth instance e.g. with geth attach /path/to/geth.ipc.
Memory
Once you are in the console, you can write out memory profiles with
> debug.writeMemProfile("mem.pprof")
This will create a mem.pprof file in your current work directory that we can later analyze.
The memory profile will contain information about all current active memory as well as where memory was allocated before.
This is especially useful if you want to check where the node allocated memory over its lifetime.
CPU
CPU profiles are a bit more complicated than memory profiles. Since they use up significantly more resources, they need to be started and stopped manually. You can start and stop CPU profiles as follows:
> debug.startCPUProfile("cpu.pprof")
...
> debug.stopCPUProfile()
This will spit out cpu.pprof in your current working directory.
This profile will contain all events that happened between starting and stopping the profile, so you should make sure to run it for a significant amount of time to capture enough events.
PProf server
If you specify the --pprof flag when starting the geth node, it will start a PProf server which can be used to dump the current goroutines, heap and allocation profiles and active mutexes.
The node will print out where the PProf server is located (default: 127.0.0.1:6060).
However I found the PProf server to be less useful than dumping out the profiles via the console and analyzing them by hand.
Analyze
Once you collected we collected our profiles, we can start analyzing them. The profiles contain information about where in the code an event happened, but in order to properly analyze them, we need to start our analyzer in the same directory that contains our source code.
So within the go-ethereum directory, you can run the interactive profiler with:
go tool pprof --cum cpu.pprof
The flag --cum will order the profile by cumulative time spent, if you remove this flag, the profile will be ordered by their own weight.
With topN you can list the top N functions, e.g.:
(pprof) top5
Showing nodes accounting for 0.01s, 0.0018% of 545.55s total
Dropped 2236 nodes (cum <= 2.73s)
Showing top 5 nodes out of 327
      flat  flat%   sum%        cum   cum%
         0     0%     0%    223.08s 40.89%  github.com/ethereum/go-ethereum/eth/downloader.(*Downloader).spawnSync.func1
         0     0%     0%    222.84s 40.85%  github.com/ethereum/go-ethereum/core.(*BlockChain).InsertChain
     0.01s 0.0018% 0.0018%    222.84s 40.85%  github.com/ethereum/go-ethereum/core.(*BlockChain).insertChain
         0     0% 0.0018%    222.84s 40.85%  github.com/ethereum/go-ethereum/eth/downloader.(*Downloader).importBlockResults
         0     0% 0.0018%    222.84s 40.85%  github.com/ethereum/go-ethereum/eth/downloader.(*Downloader).processFullSyncContent
If you want to go deeper into a function, you can use list functionName to zoom into it:
(pprof) list ApplyTransactionWithEVM
Total: 545.55s
ROUTINE ======================== github.com/ethereum/go-ethereum/core.ApplyTransactionWithEVM in github.com/ethereum/go-ethereum/core/state_processor.go
      10ms    190.22s (flat, cum) 34.87% of Total
         .          .    135:func ApplyTransactionWithEVM(msg *Message, gp *GasPool, statedb *state.StateDB, blockNumber *big.Int, blockHash common.Hash, tx *types.Transaction, usedGas *uint64, evm *vm.EVM) (receipt *types.Receipt, err error) {
         .          .    136:	if hooks := evm.Config.Tracer; hooks != nil {
         .          .    137:		if hooks.OnTxStart != nil {
         .          .    138:			hooks.OnTxStart(evm.GetVMContext(), tx, msg.From)
         .          .    139:		}
         .          .    140:		if hooks.OnTxEnd != nil {
         .          .    141:			defer func() { hooks.OnTxEnd(receipt, err) }()
         .          .    142:		}
         .          .    143:	}
         .          .    144:	// Apply the transaction to the current state (included in the env).
         .    186.80s    145:	result, err := ApplyMessage(evm, msg, gp)
         .          .    146:	if err != nil {
         .          .    147:		return nil, err
         .          .    148:	}
         .          .    149:	// Update the state with pending changes.
         .          .    150:	var root []byte
         .       10ms    151:	if evm.ChainConfig().IsByzantium(blockNumber) {
         .      1.26s    152:		evm.StateDB.Finalise(true)
         .          .    153:	} else {
         .          .    154:		root = statedb.IntermediateRoot(evm.ChainConfig().IsEIP158(blockNumber)).Bytes()
         .          .    155:	}
         .          .    156:	*usedGas += result.UsedGas
         .          .    157:
         .          .    158:	// Merge the tx-local access event into the "block-local" one, in order to collect
         .          .    159:	// all values, so that the witness can be built.
         .          .    160:	if statedb.GetTrie().IsVerkle() {
         .          .    161:		statedb.AccessEvents().Merge(evm.AccessEvents)
         .          .    162:	}
         .          .    163:
      10ms      2.15s    164:	return MakeReceipt(evm, result, statedb, blockNumber, blockHash, tx, *usedGas, root), nil
         .          .    165:}
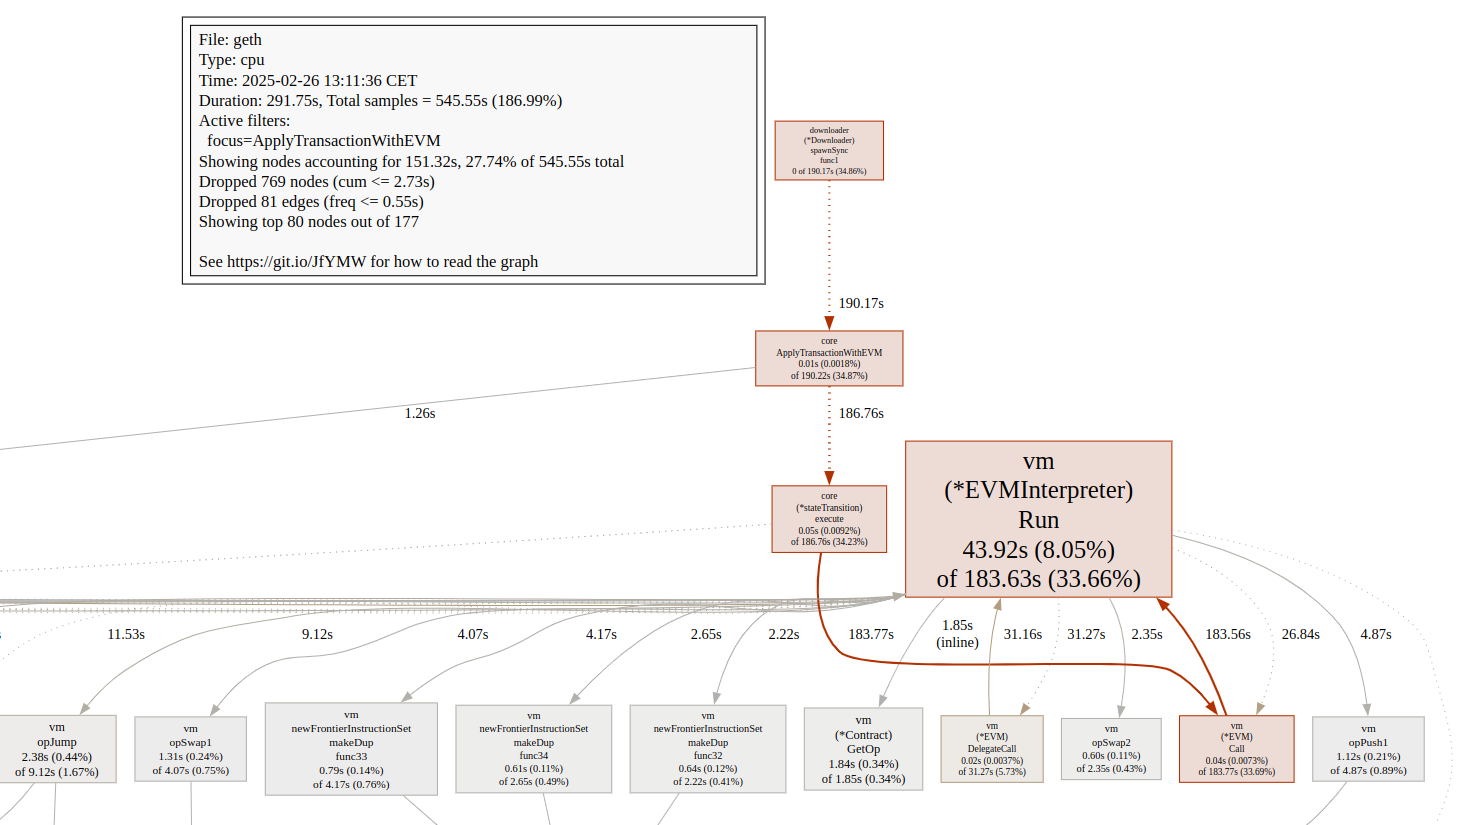
Here you can see that ~34% of all cpu time in the profile is spent during block processing. 180 seconds are spent during evm execution while 2.15 seconds are spent making the receipts.
You can also visualize important areas with web ApplyTransactionWithEVM which opens an svg file in your web browser that focuses on the function you want to visualize and everything that interacts with it.
Options
As already described previously, the most important option is probably --cum.
When analyzing memory profiles, you can switch between four different options in the interactive mode:
inuse_spaceshows you where the currently in use space was allocated, useful for finding memory leaksalloc_spaceshows you where space was allocated, not very usefulinuse_objectsshows you where the currently live objects were allocated, not very usefulalloc_objectsshows you where objects where allocated, very useful for performance optimization.
As described, alloc_objects is the most useful option for memory profiles as it shows you where objects were allocated on the heap during the test. Heap allocations are comparatively slow and allocating a bunch of small objects also has the additional overhead of inducing a lot of work for the garbage collector.
Using alloc_objects to profile the code can also show instances where objects that intuitively should be allocated on the stack might escape to the heap. Often a small refactor will improve things greatly there.
Datasets
I’ve compiled two datasets mem.pprof and cpu2.pprof from my mainnet node that was stopped for almost two months and full synced up to the head during those benchmarks for anyone who’s interested in geth’s syncing performance.
At the time of writing this blog post, I have had no time to look into them myself to see if there are any juicy improvements to be made to go-ethereum.